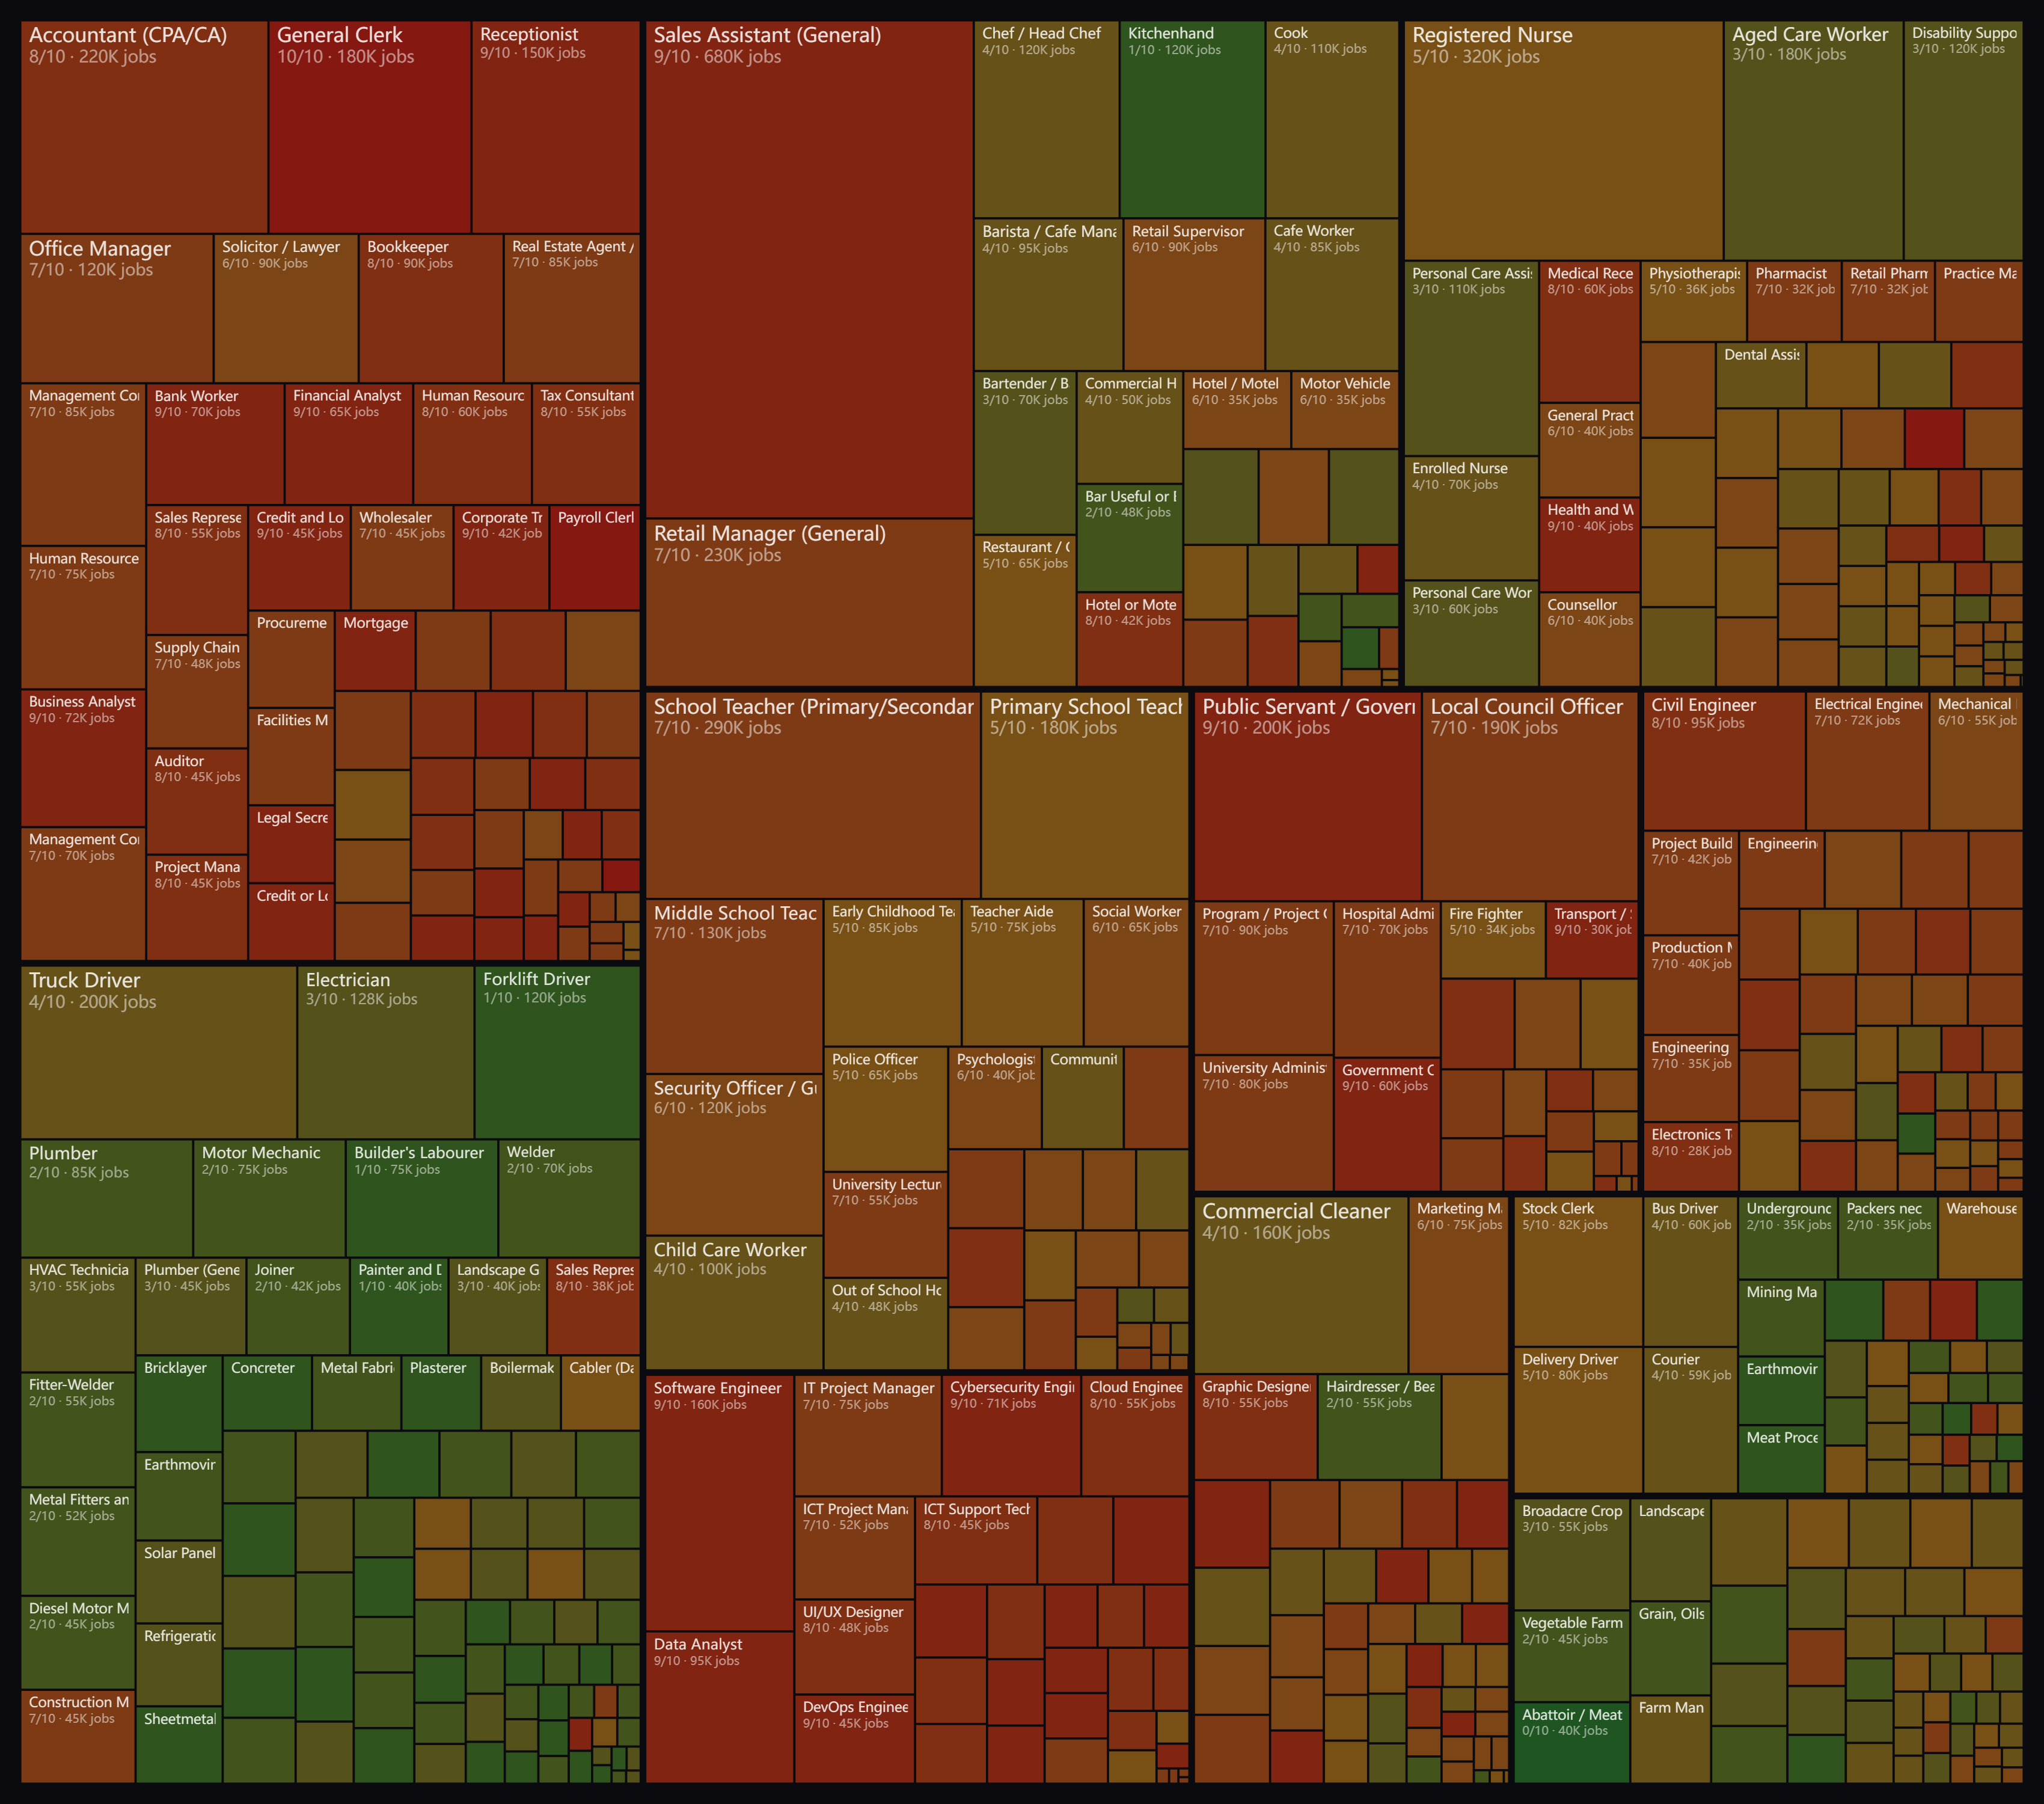
AI job risk in Australia
This analysis examines the exposure of 531 occupations, covering 14,562,050 workers in Australia, to generative AI using a 0–10 scale where higher scores indicate greater task exposure. The employment-weighted average exposure across all occupations is 5.7 out of 10. It is important to note that exposure measures the degree to which job tasks can be augmented or automated by AI, not the likelihood of job loss. A high exposure score suggests that AI is likely to reshape how tasks are performed, while low exposure indicates tasks are less amenable to AI-driven change.
Occupations with the highest exposure include General Clerk, Payroll Clerk, NDIS Plan Manager, and Money Market Clerk (all 10/10), followed by Sales Assistant, Government Administration Officer, Software Engineer, and Receptionist (9/10). These roles involve routine data processing, documentation, or information synthesis, making them particularly susceptible to AI-driven transformation. Conversely, the lowest exposure is observed in physically intensive or manual roles such as Abattoir Worker, Kitchenhand, Forklift Driver, and various trades like Bricklayer and Concreter (0–1/10), where tasks are less dependent on cognitive or language-based activities. Industries with the highest average exposure include IT & Digital (8.4/10), Business, Finance & Legal (8.0/10), and Government & Public Sector (7.5/10), while sectors like hospitality, retail, and tourism have moderate exposure (6.0/10).
20 jobs most exposed to AI in Australia
| # | Occupation | Code | Exposure | Average annual pay | Employed |
|---|---|---|---|---|---|
| 1 | General Clerk | 532111 | 10/10 | $71,292 | 180,000 |
| 2 | Payroll Clerk | 551112 | 10/10 | $71,292 | 40,000 |
| 3 | NDIS Plan Manager | 551113 | 10/10 | $71,292 | 15,000 |
| 4 | Money Market Clerk | 552313 | 10/10 | $71,292 | 5,200 |
| 5 | Sales Assistant (General) | 621111 | 9/10 | $45,656 | 680,000 |
| 6 | Public Servant / Government Administration Officer | 531112 | 9/10 | $71,292 | 200,000 |
| 7 | Software Engineer | 261312 | 9/10 | $106,600 | 160,000 |
| 8 | Receptionist | 542111 | 9/10 | $71,292 | 150,000 |
| 9 | Data Analyst | 262111 | 9/10 | $106,600 | 95,000 |
| 10 | Business Analyst | 225113 | 9/10 | $106,600 | 72,000 |
| 11 | Cybersecurity Engineer / ICT Security Specialist | 262112 | 9/10 | $106,600 | 70,900 |
| 12 | Bank Worker | 552111 | 9/10 | $71,292 | 70,000 |
| 13 | Financial Analyst | 222299 | 9/10 | $106,600 | 65,000 |
| 14 | Government Customer Service Officer | 541112 | 9/10 | $71,292 | 60,000 |
| 15 | Credit and Loans Officer | 552112 | 9/10 | $71,292 | 45,000 |
| 16 | DevOps Engineer | 261399 | 9/10 | $106,600 | 45,000 |
| 17 | Corporate Trainer / Training and Development Manager | 223211 | 9/10 | $106,600 | 42,000 |
| 18 | Health and Welfare Services Manager | 134211 | 9/10 | $145,652 | 40,000 |
| 19 | Transport / Station Officer | 451612 | 9/10 | $54,496 | 30,000 |
| 20 | Legal Secretary / Paralegal | 599411 | 9/10 | $71,292 | 28,000 |
20 jobs least exposed to AI in Australia
| # | Occupation | Code | Exposure | Average annual pay | Employed |
|---|---|---|---|---|---|
| 1 | Abattoir / Meat Process Worker | 362111 | 0/10 | $91,364 | 40,000 |
| 2 | Kitchenhand | 851311 | 1/10 | $55,536 | 120,000 |
| 3 | Forklift Driver | 721311 | 1/10 | $88,192 | 120,000 |
| 4 | Builder's Labourer | 821111 | 1/10 | $55,536 | 75,000 |
| 5 | Painter and Decorator | 332211 | 1/10 | $91,364 | 40,000 |
| 6 | Bricklayer | 331111 | 1/10 | $91,364 | 35,000 |
| 7 | Sheetmetal Trades Worker | 322211 | 1/10 | $91,364 | 28,000 |
| 8 | Concreter | 821211 | 1/10 | $55,536 | 28,000 |
| 9 | Plasterer | 333211 | 1/10 | $91,364 | 25,000 |
| 10 | Earthmoving Plant Operator | 721211 | 1/10 | $88,192 | 25,000 |
| 11 | Meat Process Worker | 831311 | 1/10 | $55,536 | 25,000 |
| 12 | Steel Fixer | 821713 | 1/10 | $55,536 | 22,000 |
| 13 | Renderer (Solid Plaster) | 333212 | 1/10 | $91,364 | 21,000 |
| 14 | Panel Beater | 324111 | 1/10 | $91,364 | 20,000 |
| 15 | Metal Engineering Process Worker | 839111 | 1/10 | $55,536 | 18,000 |
| 16 | Fencer | 821311 | 1/10 | $55,536 | 15,000 |
| 17 | Driller | 712212 | 1/10 | $88,192 | 15,000 |
| 18 | Motor Vehicle Body Painter | 324211 | 1/10 | $91,364 | 14,000 |
| 19 | Water Treatment Operator | 712914 | 1/10 | $88,192 | 12,000 |
| 20 | Crane Chaser | 821911 | 1/10 | $55,536 | 12,000 |
AI exposure by industry
| Industry | Occupations | Employed | Avg. exposure |
|---|---|---|---|
| IT & Digital | 33 | 930,500 | 8/10 |
| Business, Finance & Legal | 64 | 2,423,200 | 8/10 |
| Government & Public Sector | 25 | 930,250 | 7/10 |
| Engineering & Infrastructure | 48 | 797,500 | 7/10 |
| Hospitality, Retail & Tourism | 32 | 2,088,500 | 6/10 |
| Education & Community | 36 | 1,537,950 | 6/10 |
| Creative, Media & Personal Services | 48 | 776,400 | 6/10 |
| Healthcare & Care | 68 | 1,719,250 | 5/10 |
| Transport, Logistics & Mining | 40 | 637,400 | 4/10 |
| Agriculture & Environment | 49 | 612,100 | 3/10 |
| Trades & Construction | 88 | 2,109,000 | 3/10 |
Explore more
Frequently asked questions
How much AI risk do jobs in Australia face?
Across 531 occupations covering about 14,562,050 workers, Australia has an employment-weighted average generative-AI exposure of 5.7 on a 0–10 scale — an elevated level. A higher score means a larger share of a role's day-to-day tasks can already be performed or assisted by AI.
Which jobs in Australia are most at risk from AI?
The most exposed occupations in Australia are General Clerk, Payroll Clerk, NDIS Plan Manager, Money Market Clerk, Sales Assistant (General). These are roles built around routine information work — writing, data handling and analysis — that large language models already handle well.
Which jobs in Australia are least exposed to AI?
The least exposed occupations include Abattoir / Meat Process Worker, Kitchenhand, Forklift Driver. Physical, hands-on and in-person tasks are much harder for current AI to automate, so these roles score low.
Does a high AI exposure score mean the job will be lost?
No. Exposure measures how much of a role's tasks AI can perform or assist with — not whether the job will disappear. A high score flags where AI is most likely to reshape tasks first, and where workers may benefit from building complementary skills.
Which industries in Australia are most exposed to AI?
By employment-weighted average exposure, the most exposed industries in Australia are IT & Digital, Business, Finance & Legal, Government & Public Sector.
How is the AI exposure score calculated?
Every occupation is scored 0–10 by combining two published research datasets — the ILO's Working Paper 140 index and OpenAI's ‘GPTs are GPTs’ task-exposure study — mapped onto Australia's official occupation classification and ranked on a single global percentile scale so scores stay comparable between countries.
Methodology & sources
Every occupation is scored 0–10 for generative-AI exposure by combining two open, published research datasets — the ILO's Working Paper 140 index and OpenAI's GPTs are GPTs task-exposure study — mapped onto Australia's official occupation classification, then ranked on a single global percentile scale so the numbers stay comparable between countries. Tile area is the size of each occupation's workforce, from official statistics. Full methodology & data sources →
Download / share this map