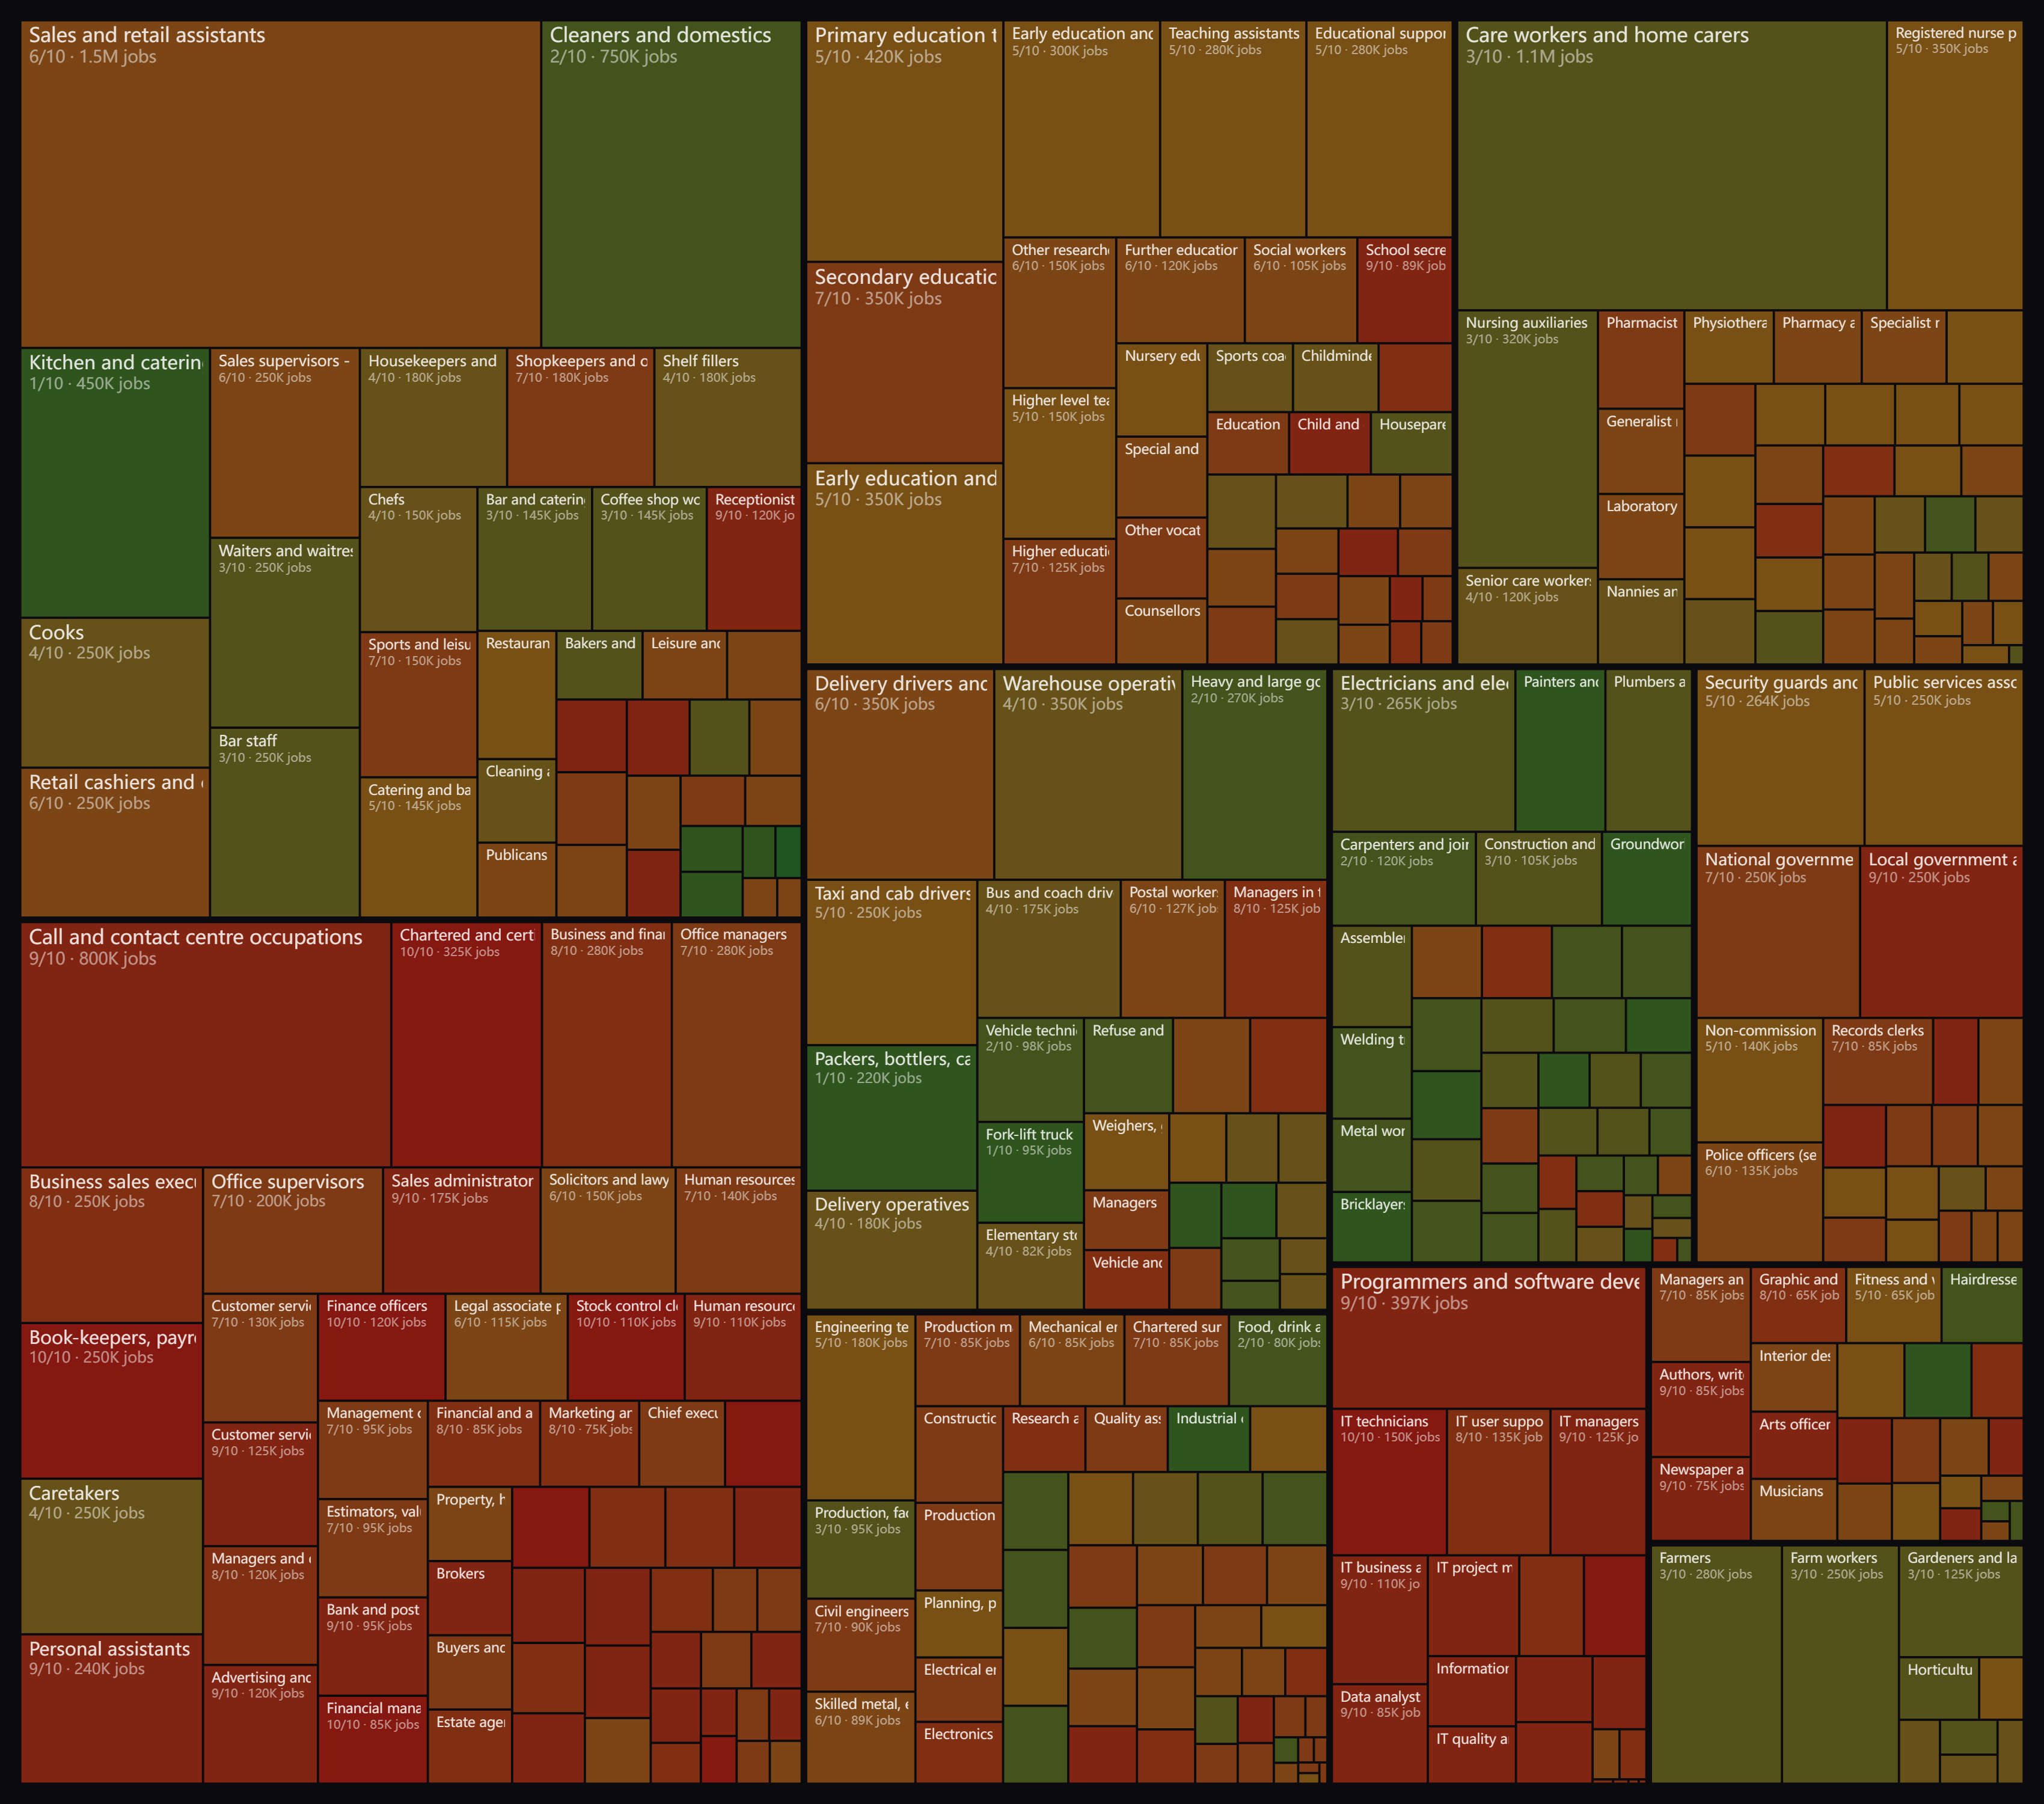
AI job risk in United Kingdom
In the United Kingdom, a comprehensive analysis of 379 occupations covering 30,865,300 workers reveals a weighted-average generative AI exposure score of 5.6 out of 10. This score, measured on a scale from 0 (no task exposure) to 10 (maximum task exposure), indicates the degree to which job tasks could be affected by AI. Importantly, exposure does not predict job loss; instead, it highlights where AI is most likely to reshape or augment work tasks first. The average score of 5.6 suggests a moderate level of potential disruption across the workforce, with significant variation among roles.
The highest exposure jobs are concentrated in administrative and professional fields, such as chartered accountants, book-keepers, IT technicians, and finance officers, all scoring 10/10. These roles typically involve data processing, routine analysis, and structured tasks that align well with current AI capabilities. In contrast, occupations requiring manual dexterity, personal interaction, or physical presence—like florists, kitchen assistants, and bricklayers—score near zero. Industry-level data shows IT & Digital leads at 9.0/10, followed by Business, Finance & Legal at 8.2/10, while industries like construction and food service exhibit much lower exposure, reflecting the hands-on nature of their work.
20 jobs most exposed to AI in United Kingdom
| # | Occupation | Code | Exposure | Average annual pay | Employed |
|---|---|---|---|---|---|
| 1 | Chartered and certified accountants | 2421 | 10/10 | £55,414 | 325,000 |
| 2 | Book-keepers, payroll managers and wages clerks | 4122 | 10/10 | £34,543 | 250,000 |
| 3 | IT technicians | 3131 | 10/10 | £39,810 | 150,000 |
| 4 | Finance officers | 4124 | 10/10 | £33,418 | 120,000 |
| 5 | Stock control clerks and assistants | 4133 | 10/10 | £33,278 | 110,000 |
| 6 | Financial managers and directors | 1131 | 10/10 | £120,529 | 85,000 |
| 7 | Data entry administrators | 4152 | 10/10 | £29,599 | 58,000 |
| 8 | Cyber security professionals | 2135 | 10/10 | £59,627 | 56,000 |
| 9 | Pensions and insurance clerks and assistants | 4132 | 10/10 | £34,761 | 55,000 |
| 10 | Typists and related keyboard occupations | 4217 | 10/10 | £27,657 | 15,000 |
| 11 | Call and contact centre occupations | 7211 | 9/10 | £28,807 | 800,000 |
| 12 | Programmers and software development professionals | 2134 | 9/10 | £63,810 | 397,000 |
| 13 | Local government administrative occupations | 4112 | 9/10 | £31,928 | 250,000 |
| 14 | Personal assistants and other secretaries | 4215 | 9/10 | £37,951 | 240,000 |
| 15 | Sales administrators | 4151 | 9/10 | £29,692 | 175,000 |
| 16 | Customer service supervisors | 7220 | 9/10 | £38,206 | 125,000 |
| 17 | IT managers | 2132 | 9/10 | £62,632 | 125,000 |
| 18 | Advertising and marketing associate professionals | 3554 | 9/10 | £41,107 | 120,000 |
| 19 | Receptionists | 4216 | 9/10 | £25,593 | 120,000 |
| 20 | Human resources administrative occupations | 4136 | 9/10 | £28,414 | 110,000 |
20 jobs least exposed to AI in United Kingdom
| # | Occupation | Code | Exposure | Average annual pay | Employed |
|---|---|---|---|---|---|
| 1 | Florists | 5443 | 0/10 | £23,416 | 12,000 |
| 2 | Kitchen and catering assistants | 9263 | 1/10 | £22,825 | 450,000 |
| 3 | Packers, bottlers, canners and fillers | 9132 | 1/10 | £27,474 | 220,000 |
| 4 | Painters and decorators | 5323 | 1/10 | £34,106 | 130,000 |
| 5 | Fork-lift truck drivers | 8222 | 1/10 | £32,719 | 95,000 |
| 6 | Groundworkers | 9121 | 1/10 | £38,309 | 75,000 |
| 7 | Bricklayers | 5313 | 1/10 | £33,379 | 50,000 |
| 8 | Industrial cleaning process occupations | 9131 | 1/10 | £29,118 | 48,000 |
| 9 | Window cleaners | 9221 | 1/10 | £29,129 | 45,000 |
| 10 | Paper and wood machine operatives | 8131 | 1/10 | £31,134 | 42,000 |
| 11 | Sheet metal workers | 5211 | 1/10 | £33,959 | 32,000 |
| 12 | Vehicle valeters and cleaners | 9226 | 1/10 | £27,385 | 30,000 |
| 13 | Marine and waterways transport operatives | 8232 | 1/10 | £43,496 | 27,000 |
| 14 | Butchers | 5431 | 1/10 | £29,731 | 25,000 |
| 15 | Launderers, dry cleaners and pressers | 9224 | 1/10 | £23,453 | 25,000 |
| 16 | Steel erectors | 5311 | 1/10 | £38,257 | 25,000 |
| 17 | Fishmongers and poultry dressers | 5433 | 1/10 | £27,093 | 15,000 |
| 18 | Stonemasons and related trades | 5312 | 1/10 | £35,061 | 8,500 |
| 19 | Cleaners and domestics | 9223 | 2/10 | £24,674 | 750,000 |
| 20 | Heavy and large goods vehicle drivers | 8211 | 2/10 | £40,136 | 270,000 |
AI exposure by industry
| Industry | Occupations | Employed | Avg. exposure |
|---|---|---|---|
| IT & Digital | 20 | 1,446,100 | 9/10 |
| Business, Finance & Legal | 56 | 5,918,500 | 8/10 |
| Creative, Media & Personal Services | 24 | 913,800 | 7/10 |
| Government & Public Sector | 22 | 1,724,500 | 6/10 |
| Education & Community | 39 | 3,672,000 | 6/10 |
| Engineering & Infrastructure | 53 | 2,166,000 | 5/10 |
| Hospitality, Retail & Tourism | 39 | 6,162,100 | 5/10 |
| Healthcare & Care | 44 | 3,220,700 | 4/10 |
| Transport, Logistics & Mining | 29 | 2,949,500 | 4/10 |
| Agriculture & Environment | 9 | 796,500 | 3/10 |
| Trades & Construction | 44 | 1,895,600 | 3/10 |
Explore more
Frequently asked questions
How much AI risk do jobs in United Kingdom face?
Across 379 occupations covering about 30,865,300 workers, United Kingdom has an employment-weighted average generative-AI exposure of 5.6 on a 0–10 scale — an elevated level. A higher score means a larger share of a role's day-to-day tasks can already be performed or assisted by AI.
Which jobs in United Kingdom are most at risk from AI?
The most exposed occupations in United Kingdom are Chartered and certified accountants, Book-keepers, payroll managers and wages clerks, IT technicians, Finance officers, Stock control clerks and assistants. These are roles built around routine information work — writing, data handling and analysis — that large language models already handle well.
Which jobs in United Kingdom are least exposed to AI?
The least exposed occupations include Florists, Kitchen and catering assistants, Packers, bottlers, canners and fillers. Physical, hands-on and in-person tasks are much harder for current AI to automate, so these roles score low.
Does a high AI exposure score mean the job will be lost?
No. Exposure measures how much of a role's tasks AI can perform or assist with — not whether the job will disappear. A high score flags where AI is most likely to reshape tasks first, and where workers may benefit from building complementary skills.
Which industries in United Kingdom are most exposed to AI?
By employment-weighted average exposure, the most exposed industries in United Kingdom are IT & Digital, Business, Finance & Legal, Creative, Media & Personal Services.
How is the AI exposure score calculated?
Every occupation is scored 0–10 by combining two published research datasets — the ILO's Working Paper 140 index and OpenAI's ‘GPTs are GPTs’ task-exposure study — mapped onto United Kingdom's official occupation classification and ranked on a single global percentile scale so scores stay comparable between countries.
Methodology & sources
Every occupation is scored 0–10 for generative-AI exposure by combining two open, published research datasets — the ILO's Working Paper 140 index and OpenAI's GPTs are GPTs task-exposure study — mapped onto United Kingdom's official occupation classification, then ranked on a single global percentile scale so the numbers stay comparable between countries. Tile area is the size of each occupation's workforce, from official statistics. Full methodology & data sources →
Download / share this map