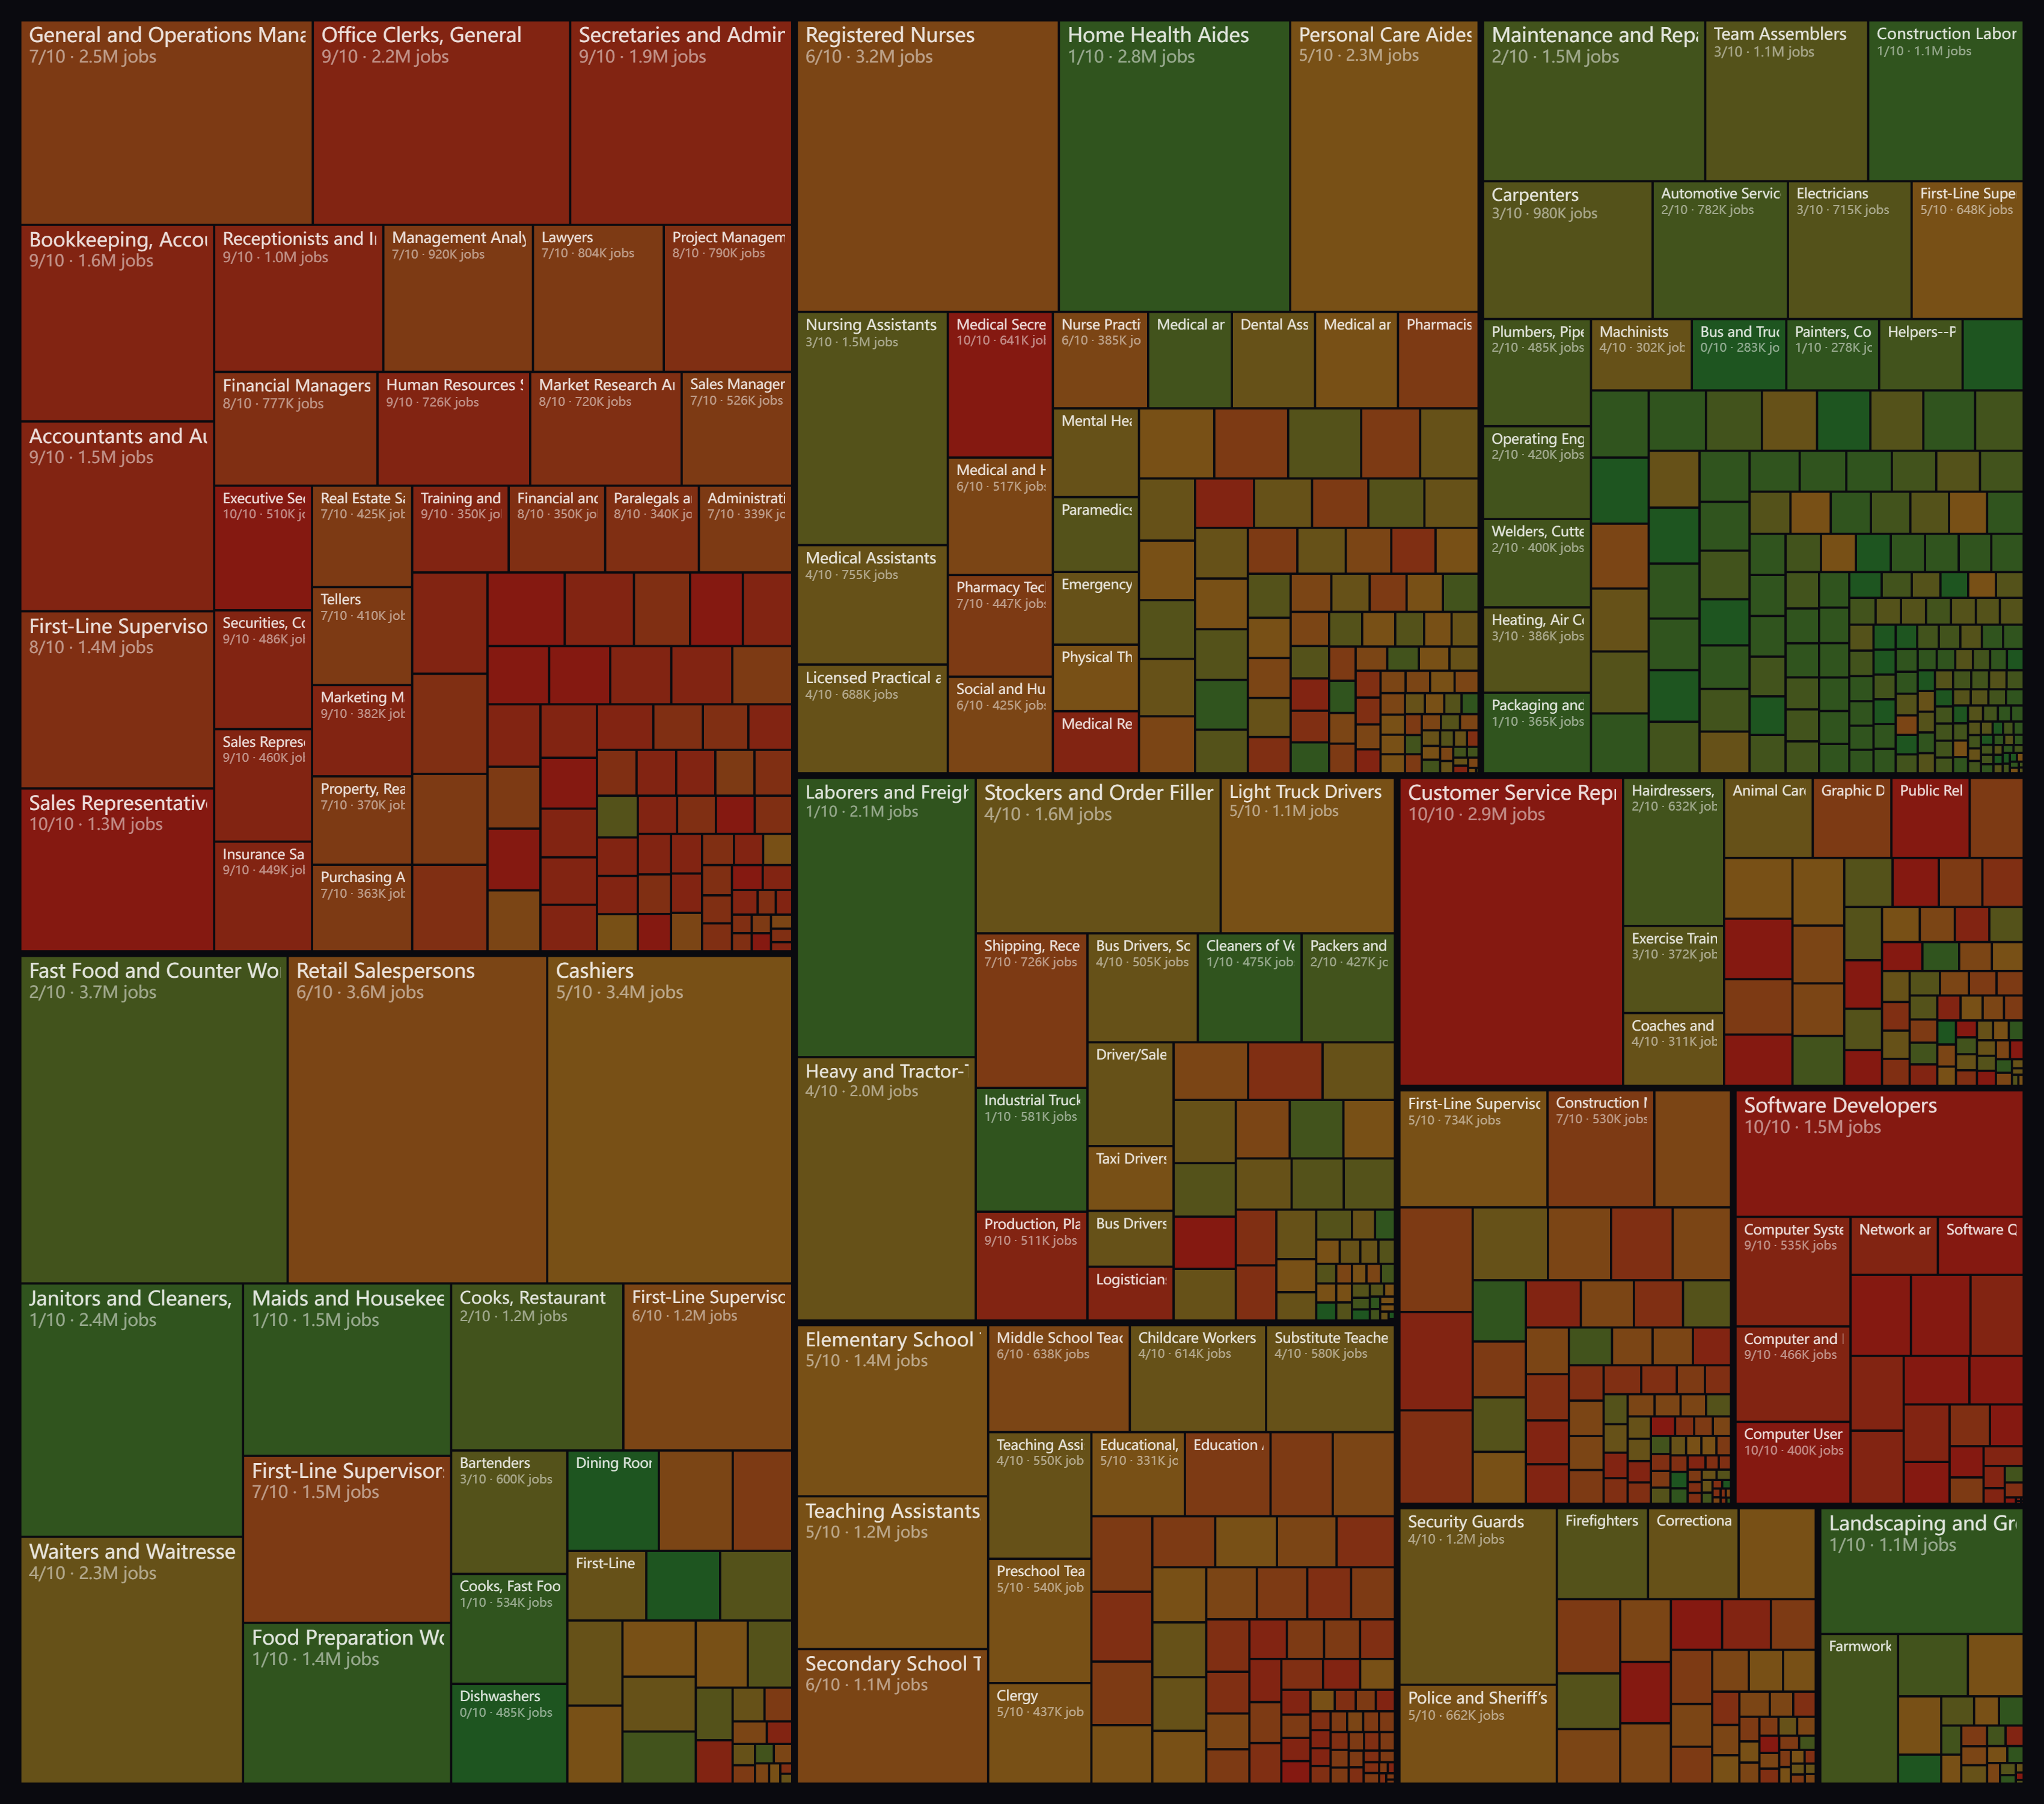
AI job risk in United States
Across the United States, we assessed how 803 occupations covering nearly 147 million workers are exposed to generative AI using a 0–10 task-exposure score. The employment-weighted average exposure is 5.3, indicating that, on average, workers are in roles where about half their tasks could potentially be affected. It is important to note that exposure does not mean job loss; rather, it signals where AI is most likely to reshape or augment tasks first, potentially changing which skills are most valued.
Occupations with the highest exposure—scoring 10/10—include customer service representatives, software developers, and several administrative roles. These jobs involve tasks like information processing, data analysis, and routine communication, which generative AI can perform or assist with. In contrast, roles that require physical presence, manual dexterity, or non-routine interactions—such as dishwashers, mechanics, and construction workers—score 0/10, as their tasks are less automatable by language models. By industry, those with the highest average exposure are IT & Digital (9.5), Business, Finance & Legal (8.4), and Creative, Media & Personal Services (7.1), reflecting the predominance of cognitive, language-based tasks.
20 jobs most exposed to AI in United States
| # | Occupation | Code | Exposure | Average annual pay | Employed |
|---|---|---|---|---|---|
| 1 | Customer Service Representatives | 43-4051 | 10/10 | $46,590 | 2,912,000 |
| 2 | Software Developers | 15-1252 | 10/10 | $148,100 | 1,548,200 |
| 3 | Sales Representatives, Wholesale and Manufacturing, Except Technical and Scientific Products | 41-4012 | 10/10 | $82,530 | 1,320,000 |
| 4 | Medical Secretaries and Administrative Assistants | 43-6013 | 10/10 | $46,800 | 640,800 |
| 5 | Executive Secretaries and Executive Administrative Assistants | 43-6011 | 10/10 | $79,140 | 510,000 |
| 6 | Computer User Support Specialists | 15-1232 | 10/10 | $67,330 | 400,000 |
| 7 | Public Relations Specialists | 27-3031 | 10/10 | $84,120 | 265,000 |
| 8 | Insurance Claims and Policy Processing Clerks | 43-9041 | 10/10 | $52,920 | 237,500 |
| 9 | Software Quality Assurance Analysts and Testers | 15-1253 | 10/10 | $111,490 | 211,300 |
| 10 | Data Scientists | 15-2051 | 10/10 | $126,800 | 208,000 |
| 11 | Web Developers | 15-1254 | 10/10 | $98,770 | 205,000 |
| 12 | Data Entry Keyers | 43-9021 | 10/10 | $43,310 | 174,700 |
| 13 | Legal Secretaries and Administrative Assistants | 43-6012 | 10/10 | $60,620 | 162,500 |
| 14 | File Clerks | 43-4071 | 10/10 | $45,590 | 150,000 |
| 15 | Payroll and Timekeeping Clerks | 43-3051 | 10/10 | $59,630 | 148,800 |
| 16 | Writers and Authors | 27-3043 | 10/10 | $86,090 | 148,000 |
| 17 | Order Clerks | 43-4151 | 10/10 | $48,220 | 136,600 |
| 18 | Dispatchers, Except Police, Fire, and Ambulance | 43-5032 | 10/10 | $54,740 | 136,500 |
| 19 | Computer Programmers | 15-1251 | 10/10 | $105,170 | 135,530 |
| 20 | Eligibility Interviewers, Government Programs | 43-4061 | 10/10 | $56,090 | 132,000 |
20 jobs least exposed to AI in United States
| # | Occupation | Code | Exposure | Average annual pay | Employed |
|---|---|---|---|---|---|
| 1 | Dishwashers | 35-9021 | 0/10 | $34,310 | 485,300 |
| 2 | Dining Room and Cafeteria Attendants and Bartender Helpers | 35-9011 | 0/10 | $34,230 | 384,000 |
| 3 | Bus and Truck Mechanics and Diesel Engine Specialists | 49-3031 | 0/10 | $64,320 | 283,000 |
| 4 | Cooks, Short Order | 35-2015 | 0/10 | $36,120 | 215,000 |
| 5 | Cement Masons and Concrete Finishers | 47-2051 | 0/10 | $60,050 | 183,000 |
| 6 | Highway Maintenance Workers | 47-4051 | 0/10 | $53,080 | 160,000 |
| 7 | Meat, Poultry, and Fish Cutters and Trimmers | 51-3022 | 0/10 | $39,280 | 135,000 |
| 8 | Electrical Power-Line Installers and Repairers | 49-9051 | 0/10 | $91,970 | 119,300 |
| 9 | Tire Repairers and Changers | 49-3093 | 0/10 | $40,170 | 110,000 |
| 10 | Slaughterers and Meat Packers | 51-3023 | 0/10 | $41,770 | 96,800 |
| 11 | Helpers--Brickmasons, Blockmasons, Stonemasons, and Tile and Marble Setters | 47-3011 | 0/10 | $50,920 | 58,300 |
| 12 | Helpers--Carpenters | 47-3012 | 0/10 | $44,050 | 55,900 |
| 13 | Agricultural Equipment Operators | 45-2091 | 0/10 | $43,710 | 54,000 |
| 14 | Paving, Surfacing, and Tamping Equipment Operators | 47-2071 | 0/10 | $59,000 | 35,000 |
| 15 | Helpers--Pipelayers, Plumbers, Pipefitters, and Steamfitters | 47-3015 | 0/10 | $43,730 | 30,000 |
| 16 | Helpers--Painters, Paperhangers, Plasterers, and Stucco Masons | 47-3014 | 0/10 | $42,440 | 23,200 |
| 17 | Automotive Glass Installers and Repairers | 49-3022 | 0/10 | $50,430 | 23,200 |
| 18 | Roustabouts, Oil and Gas | 47-5071 | 0/10 | $49,200 | 23,000 |
| 19 | Floor Layers, Except Carpet, Wood, and Hard Tiles | 47-2042 | 0/10 | $61,760 | 22,000 |
| 20 | Athletes and Sports Competitors | 27-2021 | 0/10 | $206,180 | 19,000 |
AI exposure by industry
| Industry | Occupations | Employed | Avg. exposure |
|---|---|---|---|
| IT & Digital | 29 | 5,059,030 | 10/10 |
| Business, Finance & Legal | 92 | 30,040,400 | 8/10 |
| Creative, Media & Personal Services | 69 | 8,125,100 | 7/10 |
| Engineering & Infrastructure | 79 | 5,808,400 | 6/10 |
| Education & Community | 76 | 11,540,710 | 6/10 |
| Government & Public Sector | 45 | 4,872,000 | 5/10 |
| Healthcare & Care | 110 | 21,498,840 | 5/10 |
| Transport, Logistics & Mining | 60 | 13,636,800 | 4/10 |
| Hospitality, Retail & Tourism | 40 | 26,726,100 | 4/10 |
| Trades & Construction | 179 | 17,076,350 | 2/10 |
| Agriculture & Environment | 24 | 2,407,500 | 2/10 |
Explore more
Frequently asked questions
How much AI risk do jobs in United States face?
Across 803 occupations covering about 146,791,230 workers, United States has an employment-weighted average generative-AI exposure of 5.3 on a 0–10 scale — an elevated level. A higher score means a larger share of a role's day-to-day tasks can already be performed or assisted by AI.
Which jobs in United States are most at risk from AI?
The most exposed occupations in United States are Customer Service Representatives, Software Developers, Sales Representatives, Wholesale and Manufacturing, Except Technical and Scientific Products, Medical Secretaries and Administrative Assistants, Executive Secretaries and Executive Administrative Assistants. These are roles built around routine information work — writing, data handling and analysis — that large language models already handle well.
Which jobs in United States are least exposed to AI?
The least exposed occupations include Dishwashers, Dining Room and Cafeteria Attendants and Bartender Helpers, Bus and Truck Mechanics and Diesel Engine Specialists. Physical, hands-on and in-person tasks are much harder for current AI to automate, so these roles score low.
Does a high AI exposure score mean the job will be lost?
No. Exposure measures how much of a role's tasks AI can perform or assist with — not whether the job will disappear. A high score flags where AI is most likely to reshape tasks first, and where workers may benefit from building complementary skills.
Which industries in United States are most exposed to AI?
By employment-weighted average exposure, the most exposed industries in United States are IT & Digital, Business, Finance & Legal, Creative, Media & Personal Services.
How is the AI exposure score calculated?
Every occupation is scored 0–10 by combining two published research datasets — the ILO's Working Paper 140 index and OpenAI's ‘GPTs are GPTs’ task-exposure study — mapped onto United States's official occupation classification and ranked on a single global percentile scale so scores stay comparable between countries.
Methodology & sources
Every occupation is scored 0–10 for generative-AI exposure by combining two open, published research datasets — the ILO's Working Paper 140 index and OpenAI's GPTs are GPTs task-exposure study — mapped onto United States's official occupation classification, then ranked on a single global percentile scale so the numbers stay comparable between countries. Tile area is the size of each occupation's workforce, from official statistics. Full methodology & data sources →
Download / share this map