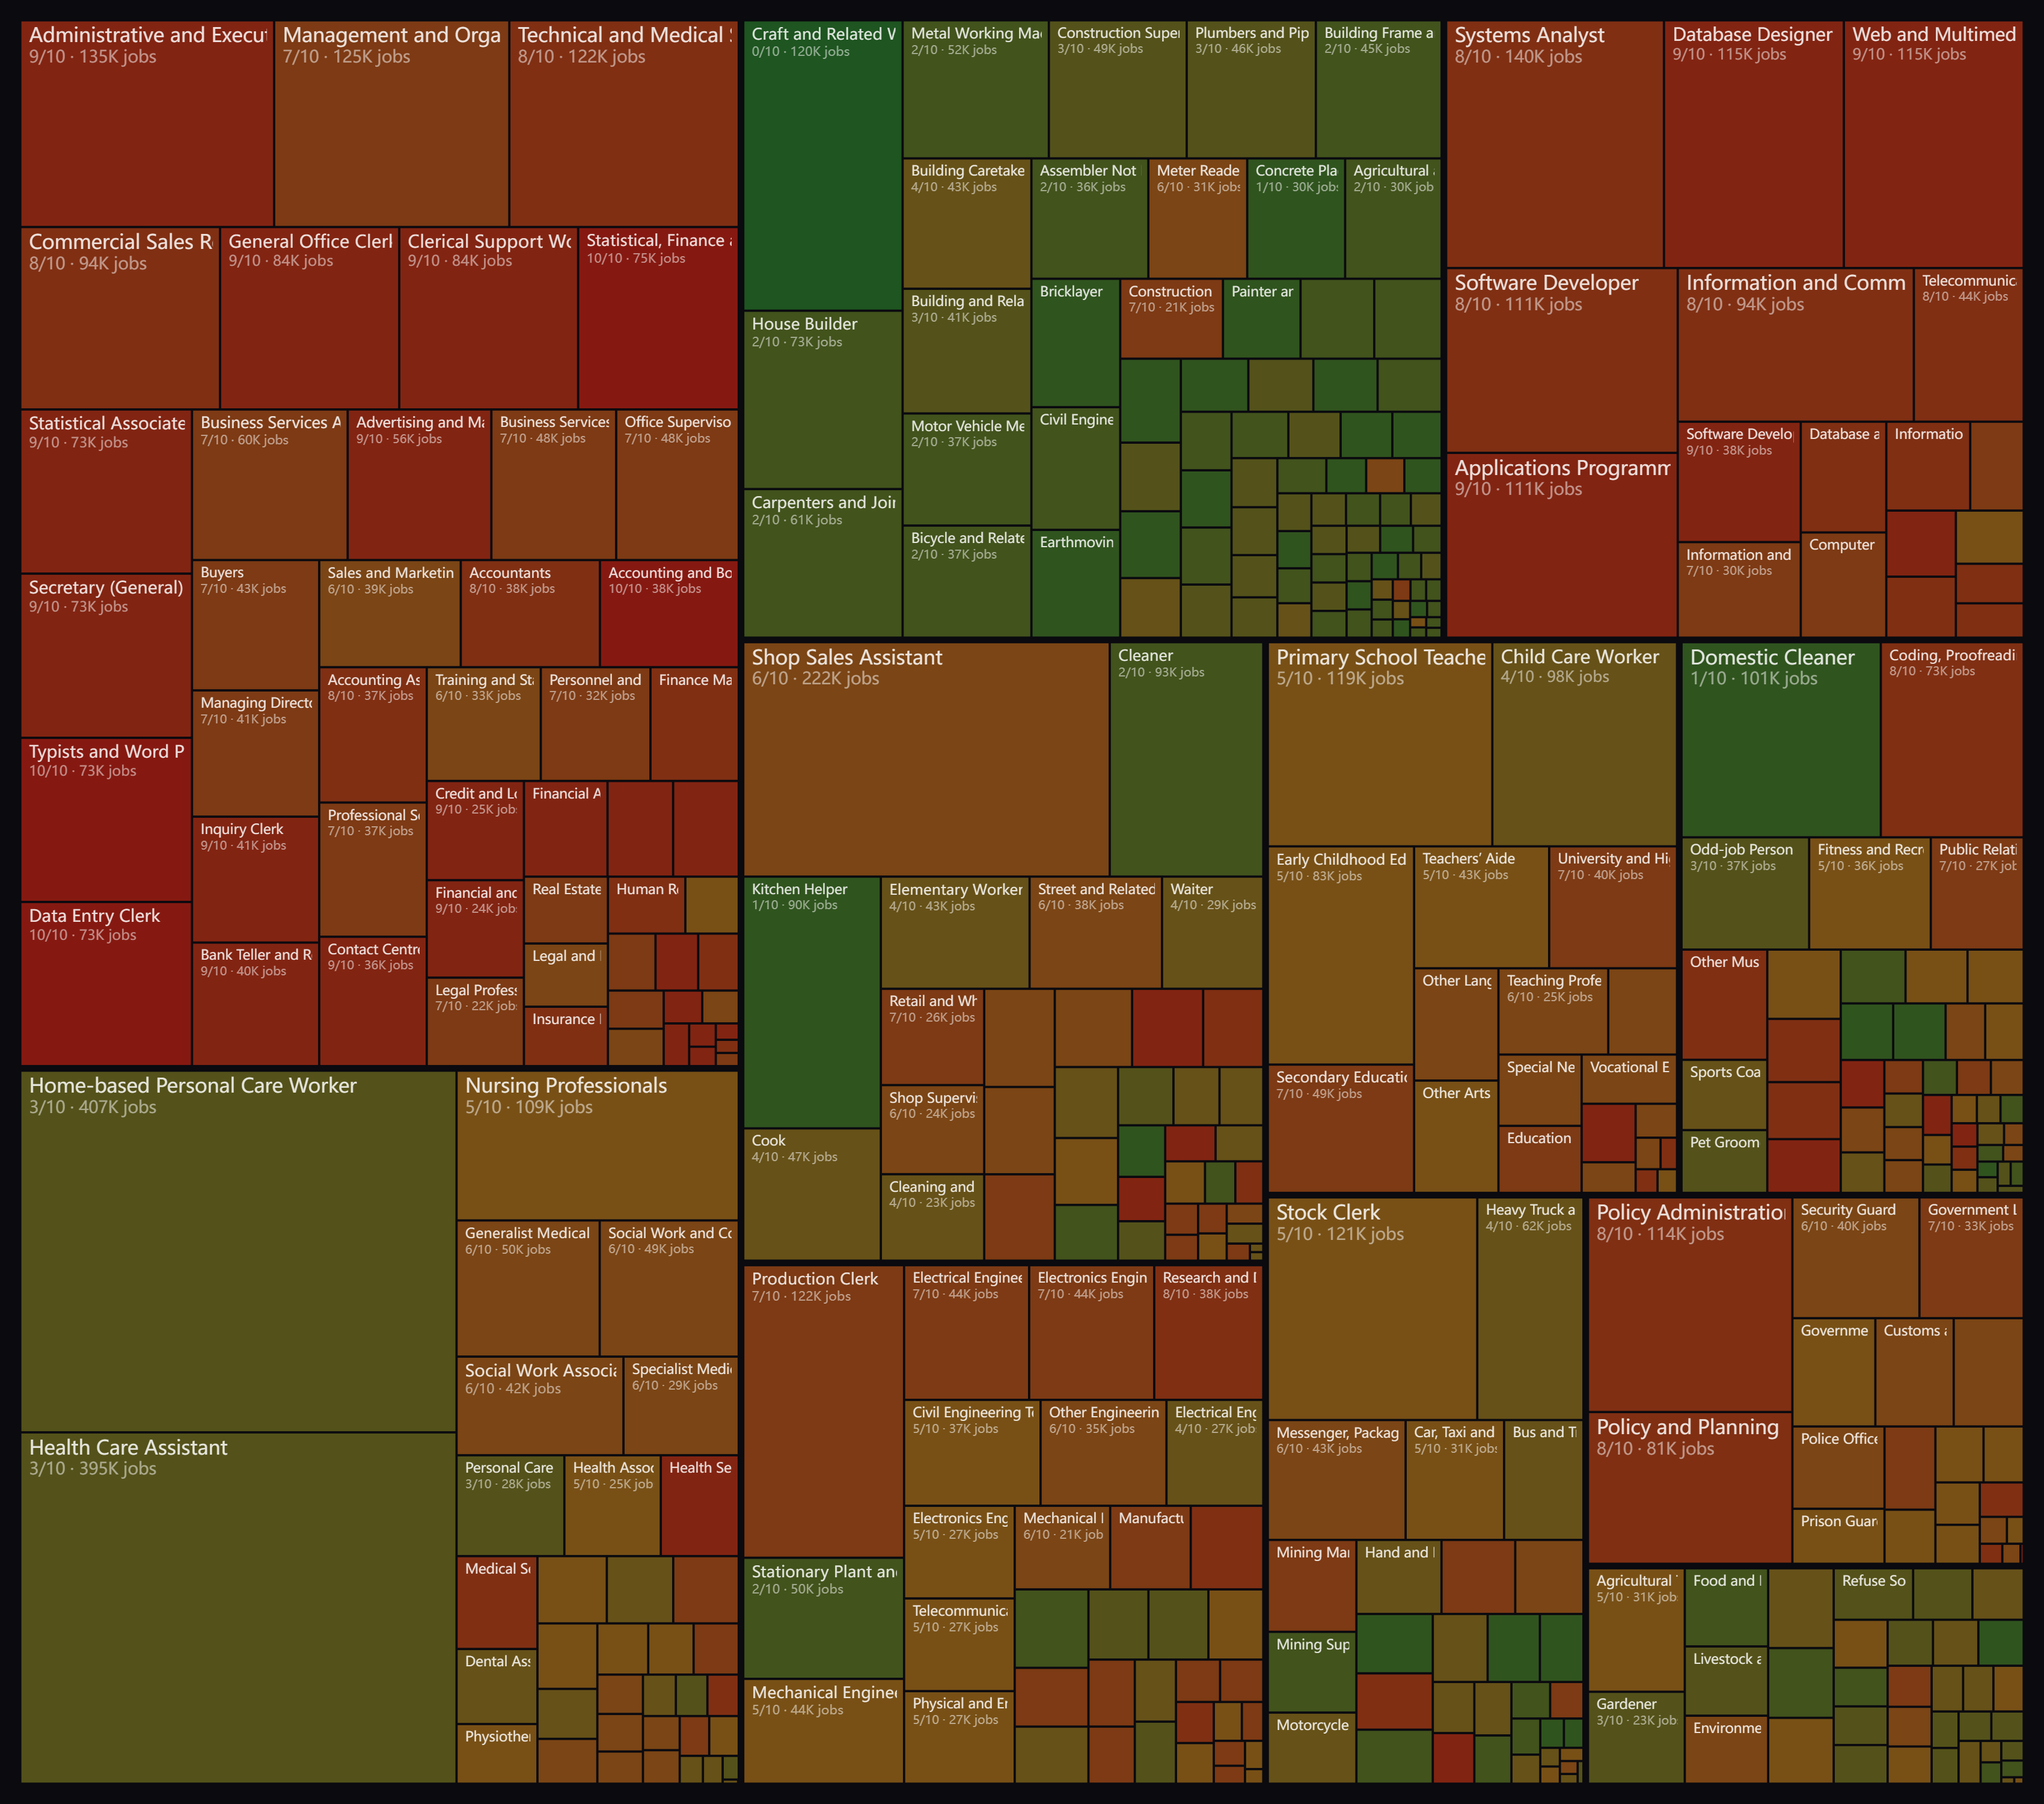
AI job risk in Sweden
Across 433 occupations covering about 9,043,566 workers, Sweden's labour market carries a elevated average exposure to generative AI of 5.6 on a 0–10 scale, weighted by how many people each occupation employs. Every score maps an occupation onto the ILO and OpenAI research indices, so a higher number means more of the role's day-to-day tasks can already be performed or assisted by AI.
The most exposed roles are Statistical, Finance and Insurance Clerk, Typists and Word Processing Operators, Data Entry Clerk — jobs built around routine information work that large language models handle well. The least exposed include Craft and Related Workers Not Elsewhere Classified, Domestic Cleaner, Kitchen Helper, where physical, in-person or hands-on tasks dominate. By industry, IT & Digital, Business, Finance & Legal sit toward the top of the range. Exposure is not the same as job loss: it flags where AI is most likely to reshape tasks first, and where workers may want to build complementary skills.
20 jobs most exposed to AI in Sweden
| # | Occupation | Code | Exposure | Average annual pay | Employed |
|---|---|---|---|---|---|
| 1 | Statistical, Finance and Insurance Clerk | 4312 | 10/10 | kr432,490 | 75,445 |
| 2 | Typists and Word Processing Operators | 4131 | 10/10 | kr430,800 | 72,573 |
| 3 | Data Entry Clerk | 4132 | 10/10 | kr430,800 | 72,573 |
| 4 | Accounting and Bookkeeping Clerk | 4311 | 10/10 | kr450,000 | 38,294 |
| 5 | Administrative and Executive Secretary | 3343 | 9/10 | kr480,853 | 135,101 |
| 6 | Database Designer and Administrator | 2521 | 9/10 | kr638,342 | 115,260 |
| 7 | Web and Multimedia Developer | 2513 | 9/10 | kr641,431 | 115,249 |
| 8 | Applications Programmer | 2514 | 9/10 | kr642,000 | 110,698 |
| 9 | General Office Clerk | 4110 | 9/10 | kr430,135 | 84,178 |
| 10 | Clerical Support Worker | 4419 | 9/10 | kr436,353 | 84,007 |
| 11 | Statistical Associate Professional | 3314 | 9/10 | kr430,800 | 72,573 |
| 12 | Secretary (General) | 4120 | 9/10 | kr430,800 | 72,573 |
| 13 | Advertising and Marketing Professional | 2431 | 9/10 | kr736,591 | 55,723 |
| 14 | Inquiry Clerk | 4225 | 9/10 | kr388,722 | 41,241 |
| 15 | Bank Teller and Related Clerk | 4211 | 9/10 | kr457,560 | 40,473 |
| 16 | Software Developer | 2519 | 9/10 | kr710,376 | 38,307 |
| 17 | Contact Centre Information Clerks | 4222 | 9/10 | kr384,000 | 35,831 |
| 18 | Credit and Loans Officer | 3312 | 9/10 | kr524,400 | 24,818 |
| 19 | Financial and Investment Adviser | 2412 | 9/10 | kr737,718 | 24,381 |
| 20 | Financial Analyst | 2413 | 9/10 | kr702,019 | 20,600 |
20 jobs least exposed to AI in Sweden
| # | Occupation | Code | Exposure | Average annual pay | Employed |
|---|---|---|---|---|---|
| 1 | Craft and Related Workers Not Elsewhere Classified | 7549 | 0/10 | kr397,087 | 119,533 |
| 2 | Domestic Cleaner | 9111 | 1/10 | kr338,378 | 101,211 |
| 3 | Kitchen Helper | 9412 | 1/10 | kr339,600 | 89,662 |
| 4 | Concrete Placer and Finisher | 7114 | 1/10 | kr480,000 | 30,436 |
| 5 | Bricklayer | 7112 | 1/10 | kr489,574 | 29,459 |
| 6 | Earthmoving and Related Plant Operator | 8342 | 1/10 | kr429,600 | 24,728 |
| 7 | Painter and Related Worker | 7131 | 1/10 | kr454,800 | 16,017 |
| 8 | Floor Layers and Tile Setters | 7122 | 1/10 | kr506,400 | 13,144 |
| 9 | Lifting Truck Operator | 8344 | 1/10 | kr436,800 | 11,805 |
| 10 | Sheet Metal Worker | 7213 | 1/10 | kr444,000 | 10,460 |
| 11 | Manufacturing Labourer Not Elsewhere Classified | 9329 | 1/10 | kr372,000 | 9,251 |
| 12 | Hand Packer | 9321 | 1/10 | kr372,000 | 9,251 |
| 13 | Plasterer | 7123 | 1/10 | kr506,400 | 8,806 |
| 14 | Hand Launderer and Presser | 9121 | 1/10 | kr363,600 | 7,718 |
| 15 | Window Cleaner | 9123 | 1/10 | kr363,600 | 7,718 |
| 16 | Vehicle Cleaner | 9122 | 1/10 | kr363,600 | 7,718 |
| 17 | Building Construction Labourer | 9313 | 1/10 | kr472,800 | 7,488 |
| 18 | Fast Food Preparer | 9411 | 1/10 | — | 6,287 |
| 19 | Woodworking Machine Tool Setter and Operator | 7523 | 1/10 | kr412,800 | 6,189 |
| 20 | Spray Painter and Varnisher | 7132 | 1/10 | kr429,600 | 5,900 |
AI exposure by industry
| Industry | Occupations | Employed | Avg. exposure |
|---|---|---|---|
| IT & Digital | 18 | 922,178 | 8/10 |
| Business, Finance & Legal | 53 | 1,934,522 | 8/10 |
| Government & Public Sector | 21 | 415,993 | 7/10 |
| Engineering & Infrastructure | 35 | 698,969 | 6/10 |
| Education & Community | 20 | 585,194 | 5/10 |
| Creative, Media & Personal Services | 48 | 490,398 | 5/10 |
| Hospitality, Retail & Tourism | 39 | 832,551 | 5/10 |
| Transport, Logistics & Mining | 34 | 481,920 | 5/10 |
| Healthcare & Care | 43 | 1,321,619 | 4/10 |
| Agriculture & Environment | 39 | 246,670 | 4/10 |
| Trades & Construction | 83 | 1,113,552 | 2/10 |
Explore more
Frequently asked questions
How much AI risk do jobs in Sweden face?
Across 433 occupations covering about 9,043,566 workers, Sweden has an employment-weighted average generative-AI exposure of 5.6 on a 0–10 scale — an elevated level. A higher score means a larger share of a role's day-to-day tasks can already be performed or assisted by AI.
Which jobs in Sweden are most at risk from AI?
The most exposed occupations in Sweden are Statistical, Finance and Insurance Clerk, Typists and Word Processing Operators, Data Entry Clerk, Accounting and Bookkeeping Clerk, Administrative and Executive Secretary. These are roles built around routine information work — writing, data handling and analysis — that large language models already handle well.
Which jobs in Sweden are least exposed to AI?
The least exposed occupations include Craft and Related Workers Not Elsewhere Classified, Domestic Cleaner, Kitchen Helper. Physical, hands-on and in-person tasks are much harder for current AI to automate, so these roles score low.
Does a high AI exposure score mean the job will be lost?
No. Exposure measures how much of a role's tasks AI can perform or assist with — not whether the job will disappear. A high score flags where AI is most likely to reshape tasks first, and where workers may benefit from building complementary skills.
Which industries in Sweden are most exposed to AI?
By employment-weighted average exposure, the most exposed industries in Sweden are IT & Digital, Business, Finance & Legal, Government & Public Sector.
How is the AI exposure score calculated?
Every occupation is scored 0–10 by combining two published research datasets — the ILO's Working Paper 140 index and OpenAI's ‘GPTs are GPTs’ task-exposure study — mapped onto Sweden's official occupation classification and ranked on a single global percentile scale so scores stay comparable between countries.
Data sources & authority for Sweden
Employment (tile area) for Sweden comes from Statistics Sweden (SCB), classified in SSYK 2012 → ISCO-08. These are official national statistics — the highest-authority source for the country’s labour market. Pay is official occupation-level earnings from the same source, shown where the source publishes it. The AI-exposure score itself is identical in method for every country: the ILO Working Paper 140 index and OpenAI’s GPTs are GPTs study, ranked on a single global percentile scale. Full methodology & all-country data sources →
Download / share this map